Procurement Model
Introduction
The systems engineer is often required to participate in procurement studies or make procurement decisions that have significant impact on the success or failure of a project. Many of these procurement decisions are complex, involve inputs from many organizations, and include technical and non-technical constraints.
Decision analysis tools such as CDP and Crystal Ball, used in conjunction in this problem, are available to the systems engineer. The important features of these tools are that they support a methodology that force discipline in structuring the problem, analyzing the results, and are self-documenting. Documentation of the rationale behind procurement decisions is always a concern.
The procurement presented in this report is to select a communications sub-system. In this case four companies were identified as candidates to submit bids. It is similar to an actual problem faced by a group of engineers on a real program.
CDP was used to develop and analyze the problem and Crystal Ball was used to generate distributions representing uncertainty in some of the data. These distributions were then entered into CDP to determine the effect of uncertainty on the procurement selection process.
Hierarchy Graph
Hierarchy Graph
The process was initiated by developing a hierarchy representing a model of the procurement. The hierarchy shows the important criteria and their sub-criteria that the bidders were to be evaluated against. In this case, the model reflects the evaluation criteria used in the bid evaluation process. The important constraints or criteria in this case were technical performance, costs, schedule, business, and manufacturing. Performance was further delineated as transmit power, frequency agility, antenna gain, and receiver noise figure. These are the major technical performance metrics to be used in evaluating the four bids. The elements of costs important in this procurement were initial procurement costs and life cycle costs. Schedule has two sub-criteria. Schedule length, and critical path elements are deemed to be important considerations on this program. The business considerations of: a) key management, b) company experience, and c) financial stability are also factors to be considered. Finally, the manufacturing capabilities of the four companies are part of the evaluation criteria in the procurement decision.
Hierarchy Data
|
Goal Level |
Weights |
Rating Set |
main criteria |
Weights |
Rating Set |
|
accept bid |
60.00 |
schedule |
schedule |
80.00 |
length |
|
90.00 |
cost |
65.00 |
critical path |
||
|
60.00 |
performance |
cost |
60.00 |
life cycle cost |
|
|
40.00 |
business |
80.00 |
initial cost |
||
|
60.00 |
manufacturing |
performance |
80.00 |
tx pwr |
|
|
|
|
|
50.00 |
agility |
|
|
|
|
|
70.00 |
ant gain |
|
|
|
|
|
65.00 |
noise fig. |
|
|
|
|
|
business |
70.00 |
management |
|
|
|
|
60.00 |
experience |
|
|
|
|
|
65.00 |
financial stability |
|
|
|
|
|
manufacturing |
80.00 |
quality rating |
Hierarchy Data
Once the hierarchy is complete, relative weights are assigned to all the criteria and appropriate scales are identified to rate or score the supplying Companies. The weights are shown in the data view of the hierarchy.
In determining the relative weights for the criteria on each level in the model, a number of default numeric or verbal scales are available. On the first and second level in this model a numeric scale of 0 to 100 was selected. Costs were considered must important and given a value of 90 followed by performance and schedule with 60. The sub-criteria under performance were weighted using the same 0 to 100 scale. The weights determined by the systems engineering team are as given in the following graph.
Each company was then rated or scored against the lower level criteria. As an example, a scale of 0 to 150 Kilowatts (KW) was used for "tx pwr." Each company was then scored against these scales using data received in the RFP responses. Both "initial costs" and "life cycle costs" were in millions of dollars. After scoring the companies against the lowest level criteria using the RFP data, the decision score or rankings were reviewed.
Decision Scores
Decision Scores
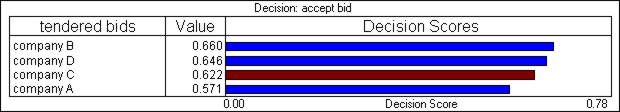
A Review of the initial results shows the rankings of the companies. Company B is highest with a score of 0.660 (a perfect score equals 1.00) followed closely by company D. Prior to making a decision based on these preliminary results, it is advisable to analyze the results for reasonableness, sensitivities to changes in weights, and to include uncertainty in the data inputs.
CDP allows rules to be added to the model. If any of the alternatives fail the rule, the results line for that alternative is red. In this model, Company C failed the rule "that transmit power must be at least 80 KW". Company C response was for 75 KW. The company is not eliminated as a result of failing this rule but is flagged for further evaluation.
Contributions
Contributions
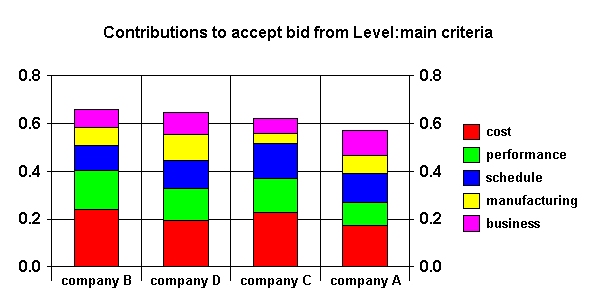
By reviewing the "Contribution by Criteria" screen, a check for "reasonableness" can be made. In this case, it can be seen that company B scores better in costs and performance then company D, but lower in manufacturing. Company C scores low in manufacturing and business. These contributions are determined to be reasonable, given both how the various companies rated against the lowest criteria and the importance we assigned the lowest criteria. The same contributions can be reviewed in a pie, radar, or trend graph as desired.
Sensitivity
Sensitivity
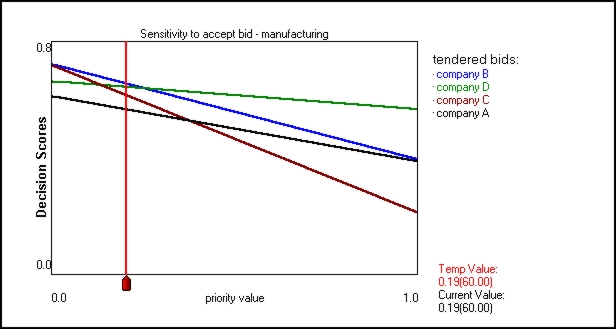
The sensitivity by weights analysis tool in CDP provides a quick answer to the question of what would happen to the results if any one of the weights were changed? The screen shows a graphical representation of the sensitivities. The X-axis shows the priority value (function of the weight) and the Y- axis is the decision score. The horizontal lines represent the alternatives (the four companies). The red cursor line and the intersection with the alternative line gives the decision scores for the current set of weights. This tool calculates the most critical to least critical criterion in the model (as shown in the "Criticality" window). In this model the most critical criterion is "manufacturing". It indicates that an increase in the weight of approximately 6.2 % would change the results. Graphically, this is shown as the crossing in the alternative lines to the right of the red cursor line. Company D would become the most preferred alternative. Since Company D scores strongly in manufacturing, this is to be expected. Likewise, a decrease in the weight for "cost" of approximately 7.3% would have the same effect. In this case, the initial weights were judged to be correct by the procurement team and the results were unchanged. Generally, if the sensitivities are less than 10%, the decision maker(s) should be advised that the model is sensitive and represents risks if the decision is based on the current inputs. In such cases, it is best to review and validate the initial weights.
Decision Scores
Decision Scores
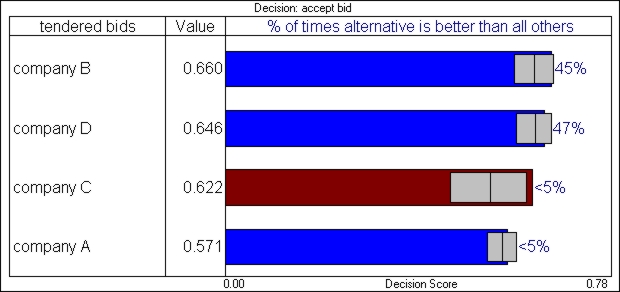
Up to this point the uncertainty has not been included. It was determined there was uncertainty in the cost and schedule data. In this procurement, a number of uncertainties were identified. These uncertainties reflected risk in: a) initial cost, b) life cycle cost, c) schedule data, d) and in the performance attributes. An analysis of the cost estimates (using Crystal Ball) generated uncertainty distributions for each alternative that were input to CDP, the remainder were approximated directly in CDP. An analysis of the cost estimates (using Crystal Ball) generated uncertainty distributions for each alternative that were input to CDP. Including these uncertainties in CDP provides a different interpretation of the results. As can be seen by the results screen which now includes uncertainty, 47% of the time company D is the best alternative and 45% of the time company B is the most preferred.
The two values being so close raises doubts as to which company is the most preferred in this procurement. You would want to have one alternative to be the best choice at least 80% of the time, before accepting it as the best alternative. With the uncertainties in your present information, there is no clear best alternative, and to make a decision now would run a high risk of not choosing the best alternative.
Uncertainty Contributions
Uncertainty Contributions
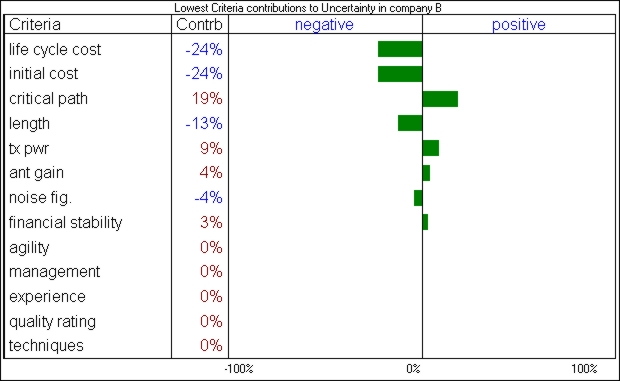
The uncertainties in this trade study indicate it is risky to make a procurement selection without further analysis. The uncertainties must be reduced in order to make the right, low risk decision for the program.
CDP allows the engineer(s) to review the contribution by uncertainties in the results for each alternative. The contribution to uncertainty screen allows the team to identify the area where the effort to reduce uncertainty should be focused. In this case, it can be seen that costs are having a negative impact on company B decision score. Reducing either makes a stronger candidate of company B. Certainly, the effort should be focused in these areas to reduce the uncertainties and thus the risk in the procurement decision. The procurement team worked with the companies to reduce the uncertainty in their cost and performance data prior to making a final decision.
Summary
This procurement decision was made more manageable by the use of CDP. Initially, it allowed all concerned with the procurement to reach a consensus as to what the important factors were and to identify the evaluation criteria the bidders were to be judged against. For the bidders, the evaluation criteria were clear. For all concerned, the decision was documented. Reducing the uncertainty by gathering more cost and performance data reduced the risk in the procurement decision. The procurement process illustrated by this model can be used in both minor and major procurements. In the case where the decision may be of public interest, a clear track record of the procurement is documented.
| InfoHarvest,
Inc. PO Box 25155, Seattle, WA 98165-2055, USA Email Tech.Support@infoharvest.com Copyright © 1999-2005 InfoHarvest, Inc. Last modified: Feb. 12, 2005 |
Phone:
1-206-686-2729 Fax: 1-206-686-2729 |