Report prepared for the Product X Release 9.0 committee
by Fixem Allsolan
January 8th, 2001
Introduction
At the
January 5th, 2001 Development Meeting it was made clear that the release date of Version 9.0 of Product X would have to be met, and that no more than two full time developers would be available. I, as lead developer of the Product X team, was asked to re-assess the features and bugs fixes that had been ear-marked for this release. Using InfoHarvest's WDObj Version 3..0 running against our Access Feature/Bug base, I prioritized all records in the database, then extracted the top 200 to a Criterium DecisionPlus 3.0 model, Rollout200.CDP[HTTP 874 KB]. This report is based on that model.Decision Hierarchy Graph
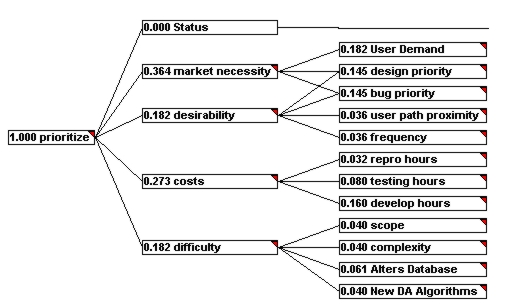
Decision Hierarchy Structure
MODEL: CDP Roll Out Prioritization
Notes:
This is the generic rollout priority model for Product X development.
Its purpose is to prioritize features and bugs for inclusion in a particular rollout.
Model Methodology: Simple Multi-Attribute Rating Technique
Goal Level: INCLUDE FEATURE?:
prioritize
This model is a cost/benefit metric to prioritize addition of suggested features and fixes to reported bugs.
Level 1: MAIN CRITERIA:
Status
This criteria is included to allow features/bugs to be excluded based on their status.
market necessity
This should reflect both Customer demands and our perception of what is required to keep CDP a market leader.
It has two questionable riders:
1) Any bug that would crash the program is awarded a 1 (highest score)
2) Any bug that would give the user false data is ascribed a 1 (highest score).
desirability
In terms of design, bugginess and annoyance to User, how important is this?
costs
Costs in time and personnel.
difficulty
General level of difficulty. In essence, this is an attempt to judge the risk of attempting to add this feature/fix this bug.
Level 2: SUB CRITERIA:
User Demand
Whether or not Users have actually asked for this feature (directly or indirectly).
Note: Any bug mentioned in a review or that is fatal or that corrupts data is given a maximum score.
design priority
In terms of coherence, completeness and coolness of design, how high does this rate?
bug priority
If this is a bug, how high is its priority?
user path proximity
How likely is the user to find themselves in that part of the product where the bug could occur.
frequency
If the user is in that part of the application where the bug is supposed to lurk, how often does it appear?
repro hours
How many hours before the bug can be accurately and concisely reproduced on demand?
testing hours
How many hours required to thoroughly test the changes.
develop hours
Estimated hours to add feature or eliminate bug.
scope
How wide spread will the changes be?
complexity
How complex is the code that would have to be written?
Alters Database
Would implementing this feature require a change in the database, with all the repercussions this has in terms of versioning etc.?
New DA Algorithms
Does any new theory have to be developed before the algorithm can be coded?
CDP Analysis - Hierarchy Model Profile
"CDP Roll Out Prioritization" - Name of Model
Weights - Hierarchy Rating Technique
SMART - Alternatives Rating Technique
13 - Number of Lowest Criteria
200 - Number of Alternatives
219 - Number of Blocks (Goal, Criteria, Phantoms and Alternatives)
0 - Number of Uncertainty Distributions
4 - Number of Levels in Hierarchy
6 - Number of user-defined Numeric Scales
11 - Number of user-defined Verbal Scales
0 - Number of user-defined Pairwise Comparison Scales
2 - Number of Rules
0 - Number of Links to Subordinate Models
Hierarchy Background Information
In the decision hierarchy you systematically identify all relations that will require quantification: subcriteria whose relative importance is to be determined with respect to main criteria, alternatives to be measured against lowest criteria. As you consider what is required to discriminate between the various alternatives, you can define new relationships between criteria, add or delete criteria, alternatives and levels.
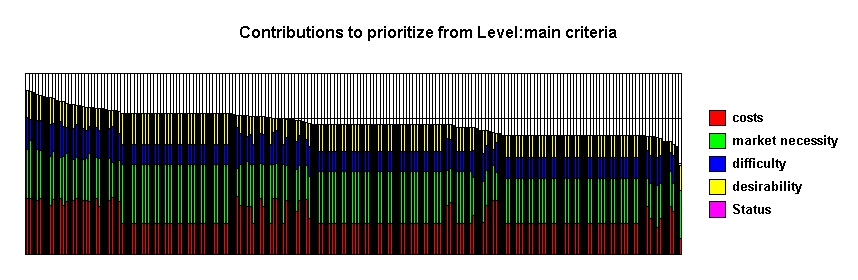
Contributions By Criteria - Stacked Bar Chart View
Contributions by Criteria Comments
It is clear that the ranking of the features/bug fixes is almost completely determined by high "market necessity" and low "costs".
Background Information
Contributions By Criteria - Stacked Bar Chart View Background
In the stacked bar chart view, you can see how the various criteria in any given level contribute to the alternatives' decision scores. It is a useful screen for checking that the decision model is reasonable in that alternatives that you expect to do well, given their high scores against the more heavily weighted criteria, do indeed to well.
Contributions By Criteria - Radar Graph View
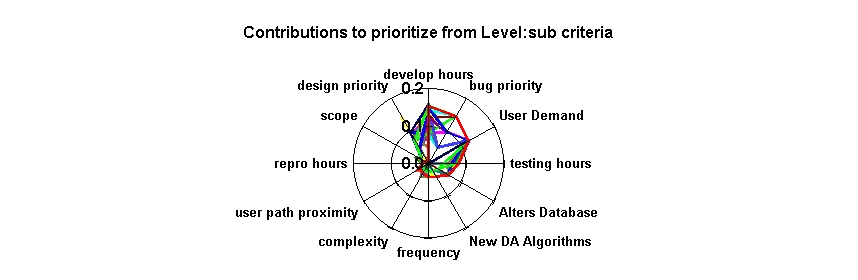
Contributions By Criteria - Radar Graph View Comments
It is clear that the subcriteria "design priority", "develop hours", "bug priority" and "User Demand" dominate the contributions to the rankings of the features/bugs. This reflects the low importance assigned to the main criteria of "difficulty" and "desirability". While we may still argue over the relative importance of "desirability", the (relatively) low importance of "difficulty" is dangerous given the tight deadline we have to finish the release.
Background Information
Contributions - Radar Chart View Background
The Radar Chart view of the Contributions By Criteria chart makes it very clear which lowest criteria, by dint both of their relatively high weights, and high scores of the alternatives against them, truly have the largest input to the outcome of the model.
Tradeoffs By Lowest Criteria
|
Reference: |
New DA Algorithms |
|
|
Best Alternative: |
Win 95 Modal |
|
|
|
|
|
|
|
|
Tradeoff |
Scale Units |
Worst |
Best |
Relative Weights |
Name |
|
infinite |
Fix Status (%) |
0.00 |
100.00 |
0% |
Status |
|
0.01 |
times requested |
0.00 |
10.00 |
450% |
User Demand |
|
0.28 |
priority (%) |
0.00 |
100.00 |
360% |
design priority |
|
0.28 |
priority (%) |
0.00 |
100.00 |
360% |
bug priority |
|
1.11 |
proximity to path (%) |
0.00 |
100.00 |
90% |
user path proximity |
|
1.11 |
frequency (%) |
0.00 |
100.00 |
90% |
frequency |
|
-0.13 |
0-10 hours |
10.00 |
0.00 |
79% |
repro hours |
|
-0.20 |
0-40 hours |
40.00 |
1.00 |
199% |
testing hours |
|
-0.10 |
0-40 hours |
40.00 |
1.00 |
397% |
develop hours |
|
-1.00 |
code impact (%) |
0.00 |
100.00 |
100% |
scope |
|
1.00 |
complexity (%) |
0.00 |
100.00 |
100% |
complexity |
|
0.67 |
No/Yes (%) |
0.00 |
100.00 |
150% |
Alters Database |
|
1.00 |
No/Yes (%) |
0.00 |
100.00 |
100% |
New DA Algorithms |
Tradeoffs Comments Here
Many of the lowest criteria have qualitative scales, which makes their tradeoff values hard to interpret. Development Hours are the key resource, and all other criteria are measured in terms of them. Obviously one could ascribe a dollar value per development hour, but since we have a finite number of developers, the key resource constraint is the total number of developer hours available.
CDP Analysis - Comments on Tradeoffs
The Reference criterion is "develop hours", and tradeoffs are specific to the highest scoring alternative, "Win 95 Modal".
In terms of the lowest criteria with numeric scales,
1 hour of develop is being traded off at 2.0 testing hours
1 hour of develop is being traded off at 1.28 repro hours
1 hour of develop is being traded off at -0.06 times requested
Background Information
In any difficult decision, many of the criteria conflict - you desire the highest quality at the lowest price. The essence of the multicriteria decision is the tradeoff between criteria. For the lowest criteria (or attributes), these tradeoffs can often be explicitly calculated in terms of the scale units of those criteria. Comparing these tradeoffs against internal or industry standards is key to validating the decision model.
Decision Scores
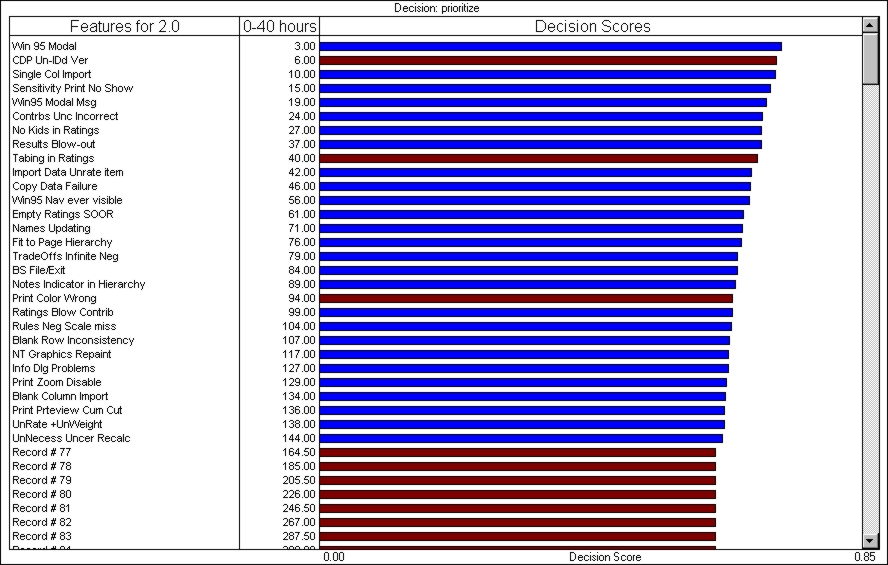
Decision Scores Comments Here
As was agreed at the meeting on January 5th, 2001, we can only have two programmers (full time) to finish the release. If the code freeze deadline is still three weeks from now, that only gives 260 work hours available. As the database assumes pure development hours, and we agreed each such "develop hour" corresponds to two physical work hours, we only have 130 develop hours available.
From the cumulative total of "develop hours" shown, we will only get down to the "Print Zoom Disable" bug. The red bars above indicate that that feature has already been put off to the next release, as was hammered out over the last week, or the bug could not be reproduced. As usual, we will generally work from the top priority features/bugs such as "WinModal 95" down, so we may not get to "Blank Column Reports", etc.
Decision Scores Background - Portfolio
When the decision task is to select more than a single alternative, you may wish to choose as many of the highest scoring alternatives as your resources allow. For instance, if each alternative has a cost, and you have a budget, you may only be able to afford the first 5 items in your prioritized list.
The Decision Scores window in DecisionPlus is a powerful tool for determining which are the best alternatives your limited resource can afford. By sorting the results by their desirability, then showing the cumulative amount of your resource required to afford all alternatives, starting with the most desirable, you can clearly determine where your budget would be exhausted.
Conclusions
We can, with two full time developers, meet the specified code freeze date. However it is likely that we will not include all those features/bug fixes that were designated for this release. Now if we could have one more week....
| InfoHarvest,
Inc. PO Box 25155, Seattle, WA 98165-2055, USA Email Tech.Support@infoharvest.com Copyright © 1999-2005 InfoHarvest, Inc. Last modified: Feb. 12, 2005 |
Phone:
1-206-686-2729 Fax: 1-206-686-2729 |