Selecting next project for Software Development Division
Prepared by A. Developer
January 1st, 2000
As directed by the Board Meeting of December 25th, 1999, the SDD has prepared a decision analysis to help select which project should be undertaken in the new millennium.
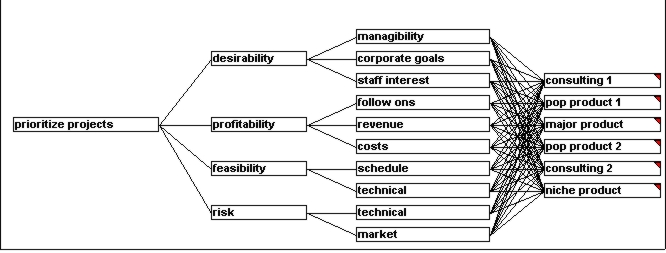
Decision Hierarchy Graph
Hierarchy Graph Comments
This decision model was kept simple, many suggested criteria being discarded during the Brainstorm phase.
CDP Analysis
This decision model has the Goal to prioritize projects.
The main criteria are:
desirability
profitability
feasibility
risk
The model is fully connected and fully rated.
Uncertainty estimates are provided for
revenue
schedule
Background Information
In the decision hierarchy you systematically identify all relations that will require quantification: subcriteria whose relative importance is to be determined with respect to main criteria, alternatives to be measured against lowest criteria. As you consider what is required to discriminate between the various alternatives, you can define new relationships between criteria, add or delete criteria, alternatives and levels. Look to the section Building and Maintaining the Hierarchy for step by step instructions on how to edit and extend the decision hierarchy.
Decision Scores
|
|
Lowest Level |
consulting 1 |
pop product 1 |
major product |
pop product 2 |
consulting 2 |
niche product |
Model Weights |
|
|
manageability |
0.75 |
0.50 |
0.25 |
0.00 |
0.50 |
0.75 |
0.05 |
|
|
corporate goals |
0.75 |
0.50 |
0.75 |
0.25 |
0.50 |
0.25 |
0.07 |
|
|
staff interest |
0.50 |
0.75 |
1.00 |
0.50 |
0.25 |
0.50 |
0.10 |
|
|
follow ons |
0.25 |
1.00 |
0.75 |
0.00 |
0.25 |
0.50 |
0.09 |
|
|
revenue |
0.23 |
0.13 |
0.83 |
0.20 |
0.10 |
0.43 |
0.18 |
|
|
costs |
0.87 |
0.90 |
0.67 |
0.80 |
0.87 |
0.70 |
0.18 |
|
|
schedule |
0.75 |
0.50 |
0.25 |
0.75 |
0.50 |
1.00 |
0.09 |
|
|
technical |
0.75 |
0.50 |
0.50 |
0.25 |
1.00 |
0.50 |
0.13 |
|
|
technical |
0.75 |
0.75 |
0.25 |
0.00 |
0.50 |
0.75 |
0.06 |
|
|
market |
1.00 |
0.75 |
0.75 |
0.50 |
0.50 |
0.75 |
0.06 |
|
|
Results |
0.62 |
0.60 |
0.64 |
0.37 |
0.51 |
0.59 |
|
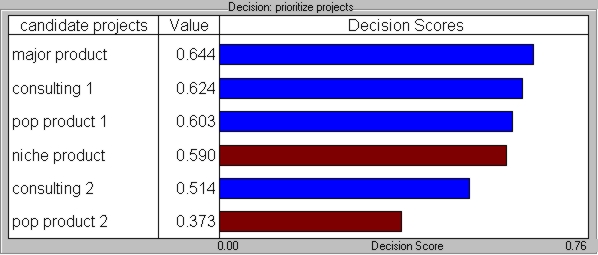
Decision Scores
On paper, based on initial point estimates, building Major Product appears to be the best alternative. Given the resources that will be required, this will be controversial.
CDP Analysis
Background Information
Now that you have determined the relative importance of the various criteria with respect to the decision goal, and scored the alternatives against those criteria, DecisionPlus calculates the aggregate score for each alternative. If you assigned rules that alternatives must meet to be considered valid solutions, those alternatives that fail those rules are flagged, and the cause of failure may be examined.
Decision Scores with Uncertainty
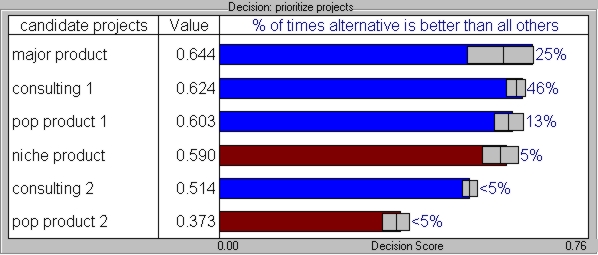
Decision Scores with Uncertainty
When uncertainties in Revenues, Cost and Schedule are introduced, Major Product is highly risky and would not be the best alternative. consulting 1 is the safer choice.
CDP Analysis
Based on point estimates only, Major Product is the best alternative, with a decision score of 0.644.
The alternatives consulting 2 and pop product 2 are significantly poorer than all other alternatives.
Niche product and pop product 2 both fail one or more Rules requirements.
Taking uncertainty into account, consulting1 would be the best solution 46% of the time. major product would be the best 25% of the time, and could be a significantly better choice than consulting1. consulting1 is not a compelling best alternative.
Background Information
Now that you have determined the relative importance of the various criteria with respect to the decision goal, and scored the alternatives against those criteria, DecisionPlus calculates the aggregate score for each alternative. If you assigned rules that alternatives must meet to be considered valid solutions, those alternatives that fail those rules are flagged, and the cause of failure may be examined. When you assigned uncertainty distributions to the alternatives ratings, those uncertainties are propagated through the hierarchy and produce distributions in each alternative's decision score, as described in the section Reviewing Your Results
Contributions by Criteria
|
|
major product |
consulting 1 |
pop product 1 |
|
|
profitability |
0.333333343267441 |
0.16666667163372 |
8.88888910412788E-02 |
|
|
desirability |
0.217777788639069 |
0.141975313425064 |
0.16666667163372 |
|
|
feasibility |
0.272592604160309 |
0.135802462697029 |
0.111111111938953 |
|
|
risk |
0.245925933122635 |
0.104938268661499 |
0.155555561184883 |
|
|
major product |
0.194074079394341 |
8.64197537302971E-02 |
0.177777782082558 |
|
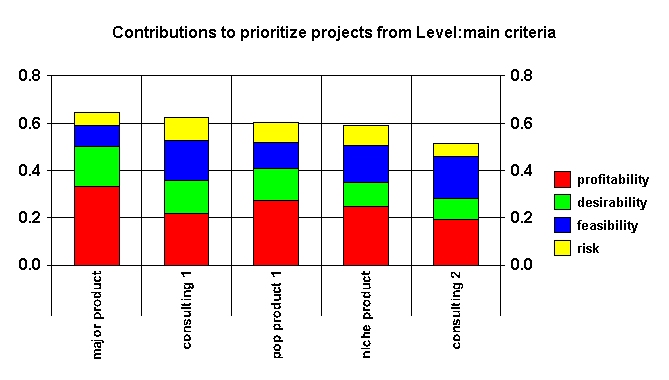
Contributions by Criteria
It is the profitability of major product that makes it the best alternative on paper. But that profitability is driven by revenue numbers for which we have very poor estimates with large uncertainties.
CDP Analysis
Major products has the highest contributions from profitability (0.27) and desirability (0.9), which allow it to overcome the lowest contributions from feasibility (0.3) and risk (0.2).
Background Information
Contributions by Criteria (Stacked Bar)
With your first results in front of you, it is time for serious reflection. Examine the stacked bar graphs in the Contributions by Criteria window to see whether the prioritization of the alternatives, as determined by the model, makes sense? See why the best alternative has a higher score compared to the next best.
| InfoHarvest,
Inc. PO Box 25155, Seattle, WA 98165-2055, USA Email Tech.Support@infoharvest.com Copyright © 1999-2005 InfoHarvest, Inc. Last modified: Feb. 12, 2005 |
Phone:
1-206-686-2729 Fax: 1-206-686-2729 |