Introduction
With fast-tracked technology and the competitive need to get the right product to the market as fast as possible, businesses have a real challenge in managing their product development efforts. Success of the business is based on sound decision making in how to allocate research funds, initiation of new programs or projects, "killing" or accelerating projects, and launching the products with the highest probability of success.
This process is one of managing the portfolio of new products or, as used in this report, simply "Portfolio Management". R.G. Cooper, S. J. Edgett, and E.J. Kleinschmidt in their book, "Portfolio Management for New Products," Perseus Books, provides the following definition of "portfolio management:"
Portfolio management is a dynamic process, whereby a business’s list of active new product (and R&D) projects is constantly updated and revised. In this process, new projects are evaluated, selected, and prioritized; existing projects may be accelerated, killed, or deprioritized: and resources are allocated and reallocated to active projects. The portfolio decision process is characterized by uncertain and changing information, dynamic opportunities, multiple goals and strategic considerations, interdependence among projects, and multiple decision-makers and locations.
The portfolio decision process encompasses or overlaps a number of decision-making processes within the business, including periodic reviews of the total portfolio of all projects (looking at the entire set of projects, and comparing all projects against each other); making Go/Kill decisions on individual projects on an ongoing basis; and developing a new product strategy for the business, complete with strategic resource allocation decisions.
The above definition sums very well the portfolio management challenge. Years as a Product Line Manager in the Product Development Organization for a large corporation has provided the necessary motivation to seek better solutions to the decision making problems associated with portfolio management. This report illustrates how the use of decision analysis techniques can be applied to the problem. InfoHarvest's Criteriumâ DecisionPlusâ (CDP) is a multi-criteria decision analysis software tool that has been used to enhance the portfolio decision problem. The following sections will illustrate its application.The Portfolio Model
As each business has a unique culture or process in place to manage their product development, decision models designed to work for one company need to be modified for another. In fact there is not one model that can be applied to the entire product development process. If a company is employing a Stage-Gateâ process proposed by R. G. Cooper, or one similar, then there are a number of models that need to be applied at each gate or stage of development.
The model selected for this report is essentially based on the process used by Hoechst-AG chemical company as documented in Cooper’s, et al, book listed above. Liberties were taken to include other important decision factors or criteria such as cost and schedule performance providing true project performance metrics. In this example four projects are being managed by the product development organization. They are the "High Tech Project" representing the companies desire to leap frog the competition. The "Product Derivative" project which is based on a derivative of an existing product. The "New Market Segment Project" which is attempting to carve-out a new market niche. And the conservative "Product Improvement Project" which is improving an existing product item.
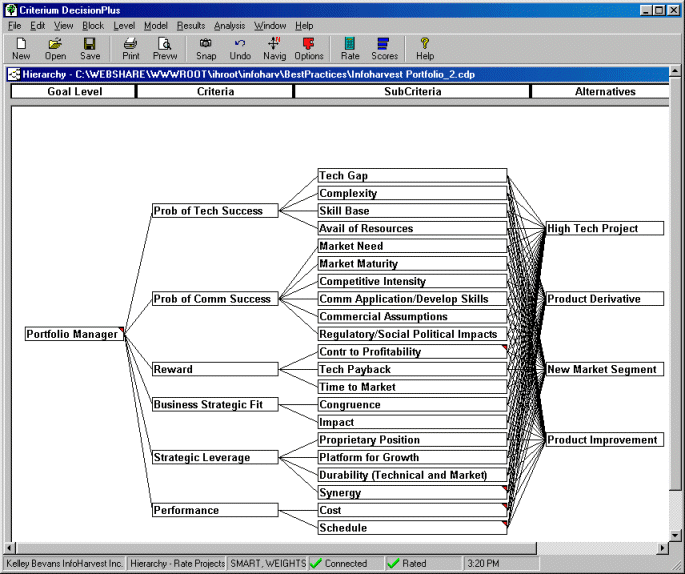
The model is designed to support a "GO/Kill" decision on the four projects. The company needs to eliminate one or more projects to stay within their budgetary limits. Situation like this, are real and the decision may have long- range effects on the company’s performance or, in some cases, survival. The hierarchical decision model for capturing the modified Hoechst-AG process is given below (a screen capture from CDP).
The model is a hierarchy of criteria or factors to be used to evaluate the four Projects. The first level of criteria identifies Probability of Technical Success, Probability of Commercial Success, Reward, Business Strategic Fit, Strategic Leverage, and Performance as the important to consider in the evaluation. These are further delineated in the next level. These lower level criteria are also called attributes and are connected to the alternative. Each project is scored against the scale or metric assigned to the lower level criterion or attribute. Again, all the criteria are those used by Hoechst-AG in their process except the cost and schedule performance.
After the hierarchy has been generated, relative weights are assigned to the criteria on each level of the hierarchy. As the hypothetical situation for this model is one of a budget problem and long term strategic fit, the weights for these criteria are assigned higher weights. CDP allows the decision-makers to use default scales in assigning the weights or to create scales that are more appropriate. The default scale of 1 to 10 is used for this model. The weights for this model are given below.
|
Weights |
Rating Set |
No Level Name |
Weights |
Rating Set |
|
7 |
Prob of Tech Success |
Prob of Tech Success |
9.5 |
Tech Gap |
|
8 |
Prob of Comm Success |
|
8 |
Complexity |
|
8 |
Reward |
|
9 |
Skill Base |
|
9 |
Business Strategic Fit |
|
10 |
Avail of Resources |
|
9 |
Strategic Leverage |
Prob of Comm Success |
10 |
Market Need |
|
10 |
Performance |
|
9 |
Market Maturity |
|
|
9.5 |
Competitive Intensity |
||
|
|
8.5 |
Comm Application/Develop Skills |
||
|
|
7 |
Commercial Assumptions |
||
|
|
7 |
Regulatory/Social Political Impacts |
||
|
Reward |
10 |
Contr to Profitability |
||
|
|
9 |
Tech Payback |
||
|
|
9.5 |
Time to Market |
||
|
Business Strategic Fit |
5 |
Congruence |
||
|
|
5 |
Impact |
||
|
Strategic Leverage |
9.5 |
Proprietary Position |
||
|
|
9 |
Platform for Growth |
||
|
|
9 |
Durability (Technical and Market) |
||
|
|
9.5 |
Synergy |
||
|
Performance |
10 |
Cost |
||
|
|
8 |
Schedule |
Defining Scales to Rate Alternatives
After the weights are completed, the decision-makers rate each project against the attributes (lowest level criteria – those attached to the projects). Ratings are determined by evaluating the projects against the scales assigned to the attributes. The scales can be quantitative or qualitative and can be created by the decision-makers. In this model, the Hoechst-AG process is used for all but the performance (cost and schedule) attributes. The Hoechst-AG scales are qualitative whereas the cost and schedule are quantitative.
The scale used for the attributes are given below:
Technology Gap:
Incremental Improvement = 10
Step-change = 7
Order of Magnitude = 4
Large Gulf = 1
Infinity = 0
Complexity:
Straightforward = 10
Do-able = 7
Many Hurdles = 4
Difficult = 1
Infinity = 0
Skill Base:
Widely Practiced = 10
Selectively Practiced = 7
Some R&D = 4
New = 1
Zero = 0
Avail of Resources:
Immediately Available = 10
Mostly Available = 7
Key Area Shortages = 4
Must Hire/build = 1
Zero = 0
Market Need:
Substitute Existing Product = 10
Replace Competitor = 7
Tailoring Required = 4
No Apparent Need = 1
Zero = 0
Market Maturity:
Rapid Growth = 10
Modest Growth = 7
Mature = 4
Declining = 1
Zero = 0
Competitive Intensity:
Low = 10
Moderate/low = 7
Moderate/high = 4
High = 1
Infinite = 0
Comm Application/ Develop Skills:
In Place = 10
Tailor = 7
Limited Use = 4
New = 1
Zero = 0
Commercial Assumptions:
High Predict/High Impact = 10
High Probability/High Impact = 7
Low Predict/Low Impact = 4
Low Probability/Low Impact = 1
None = 0
Regulatory/Social Political Impacts:
Positive = 10
Favorable = 7
Neutral = 4
Negative = 1
Zero = 0
Contribution to Profitability:
More than $250M = 10
$150M = 7
$50M = 4
Less than $10M = 1
Zero = 0
Technology Payback:
Less than 3 years = 10
5 years = 7
7 years = 4
Less than 10 years = 1
Infinite = 0
Time to Market:
Less than 1 year = 10
3 years = 7
5 years = 4
Less then 7 years = 1
Infinite = 0
Congruence:
Strong Fit = 10
Good Fit = 7
Modest Fit = 4
Peripheral = 1
None = 0
Impact:
Business Unit Future = 10
Significant = 7
Moderate = 4
Minimal = 1
None = 0
Proprietary Position:
Position Protected = 10
Solidly Protected = 7
Protected = 4
Easily Copied = 1
None = 0
Platform for Growth:
Opens up New Growth = 10
Potential for Diversification = 7
Business Extension = 4
Dead End = 1
None = 0
Durability (Technical and Market):
Long Life Cycle = 10
Moderate Life = 7
Few Good Years = 4
No Distinctive Advantage =1
None = 0
Synergy:
Wide Across Company = 10
Applications Across Several Business Units = 7
Applied to another Business Unit = 4
Limited to One Business Unit = 1
None = 0
Performance – Cost:
Cost = $0 to $10M in "to go" cost
Performance – Schedule:
Schedule = (Predicted Schedule)/(Actual Schedule) = 0.3 to 3.00
Ratings of Alternatives
The decision-makers, using all the data available to them, rated the projects against the attribute (using the scales described above) as follows:
|
Criteria |
Units |
Minimum |
Maximum |
Value |
|
High Tech Project |
||||
|
Tech Gap |
Tech Gap |
Infinity |
Incremental Improv |
Large Gulf |
|
Complexity |
complexity |
infinite |
Straightforward |
many hurdles |
|
Skill Base |
Skill Base |
zero |
widely practiced |
some R&D exp |
|
Avail of Resources |
Resource Availability |
zero |
immediately avail |
mostly avail |
|
Market Need |
market need |
Zero |
Substitute Existing Prod |
Substitute Existing Prod |
|
Market Maturity |
Market Maturity |
Zero |
Rapid Growth |
Rapid Growth |
|
Competitive Intensity |
Competitive Intensity |
Infinite |
Low |
Low |
|
Comm Application/Develop Skills |
Comm Apps |
Zero |
In Place |
New to Company |
|
Commercial Assumptions |
Comm assumptions |
none |
High Predict/High Impact |
High Predict/High Impact |
|
Regulatory/Social Political Impacts |
impacts |
Zero |
Positive |
Neutral |
|
Contr to Profitability |
Contribution |
Zero |
More than $250M |
$50M |
|
Tech Payback |
Tech Payback |
Infinite |
Less than 3 yrs |
Less than 3 yrs |
|
Time to Market |
Time to Market |
Infinite |
Less than 1 yr |
5 yrs |
|
Congruence |
congruency |
none |
strong fit |
good fit |
|
Impact |
Impact |
none |
bus unit future |
significant |
|
Proprietary Position |
Proprietary |
none |
Position Protected |
Solidly Protected |
|
Platform for Growth |
Growth |
none |
opens up new fields |
opens up new fields |
|
Durability (Technical and Market) |
Durability |
none |
long life cycle |
moderate life cycle |
|
Synergy |
Synergy |
None |
Wide-across company |
Limited to one bus unit |
|
Cost |
to go $Millions |
0 |
10 |
8 |
|
Schedule |
schedule performance |
0.3 |
3 |
0.4 |
Initial Results
The model is complete and ready for the decision-makers to review the initial results. It should be noted that this is the first review of the results and there is more analysis required before the Go/Kill decision on the four projects. The initial results are given below:
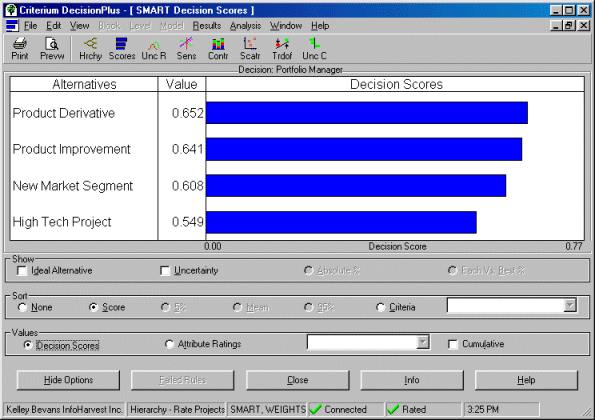
A perfect score equals 1.00. It can be seen that the Product Derivative and Product Improvement Projects do well in the scoring with the New Market Segment Close behind.
Validation
The task now is to analyze the results before making any conclusions. First, the question as to whether the results are reasonable should be addressed. The "contributions by criteria" screen provided by CDP assist in this task. The screen graphic is as shown below:
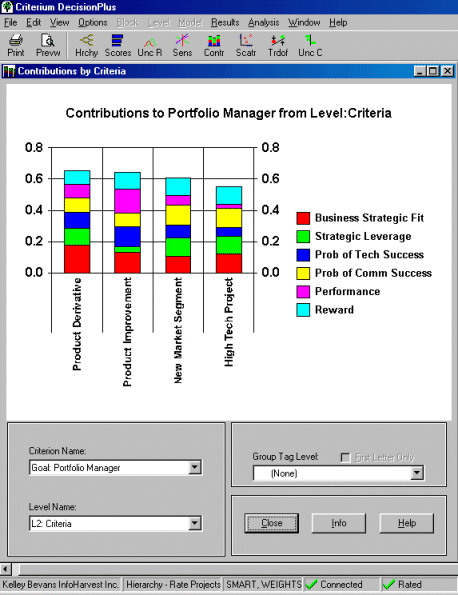
From the "contribution screen," one can determine if the results are reasonable based on the contributions from the major criteria (CDP allows the analysis to view the contributions at each level in the hierarchy). " Strategic Leverage" is a good example. It can be seen that all the projects except "Product Improvement" do well in this area. The decision-makers agree that the results are reasonable.
Sensitivity to Weights
The next analysis to perform on the model and results is to answer the question as to how sensitive the results are to the weights assigned to the criteria. CDP has an analytical tool to provide insight into this question. The screen graphic from this is given below:
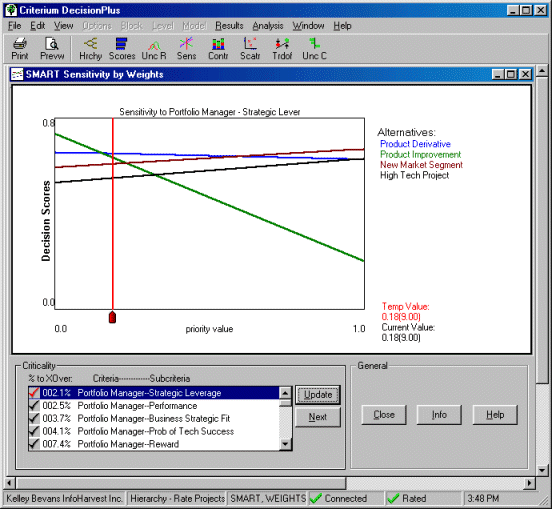
The sensitivity by weights analysis tool in CDP provides a quick answer to the question of what would happen to the results if the weights were changed? The screen shows a graphical representation of the sensitivities. The X-axis shows the priority value (function of the weight) and the Y- axis is the decision score. The horizontal lines represent the alternatives (the four projects). The red cursor line and the intersection with the alternative line gives the decision scores for the current set of weights. This tool calculates the most critical to least critical criterion in the model (as shown in the "Criticality" window).
In this model the most critical criterion is "Strategic Leverage." It indicates that a decrease in the weight of approximately 2.1 % would change the results. Graphically, this is shown as the crossing in the alternative lines to the left of the red cursor line. Product Improvement becomes the most preferred alternative. Generally, if the sensitivities are less than 10%, the decision maker(s) should be advised that the model is sensitive and represents risks if the decision is based on the current inputs. In such cases, it is best to review and validate the initial weights. This model has a number of weights that are sensitive and the decision-makers should review the weight assignments prior to making a firm decision.
Tradeoffs
Every decision involves tradeoffs. In the end, the decision means that one element is being traded-off for another. CDP provides the decision-makers with the ability to consider what tradeoffs are being made in each decision. In fact, the decision process itself may encompass tradeoffs in assigning weights. The tradeoffs in this decision are given below:
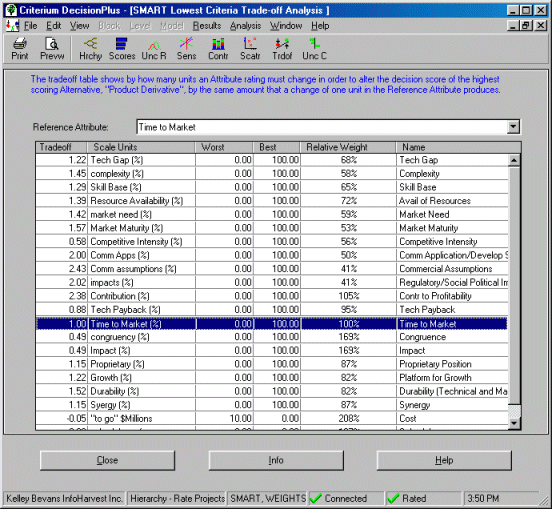
If "Time to Market" is an important element in the model, then the question is: using that as a reference, what are the decision-makers trading off in the decision? The analysis indicates for each unit of "Time to Market" that equals a factor of 2.38 in "Contributions to Profit’ and only 0.88 in "Technology Payback ", etc.
Budgeting
Because deciding which projects are "Go" or "Kill" at this stage in the development process, is heavily dependent on available budget, CDP provides another view of the results to assist the decision-makers. The results can be viewed with the cumulating of "To Go Costs" included in the results screen. The cumulative costs versus the results are given below":
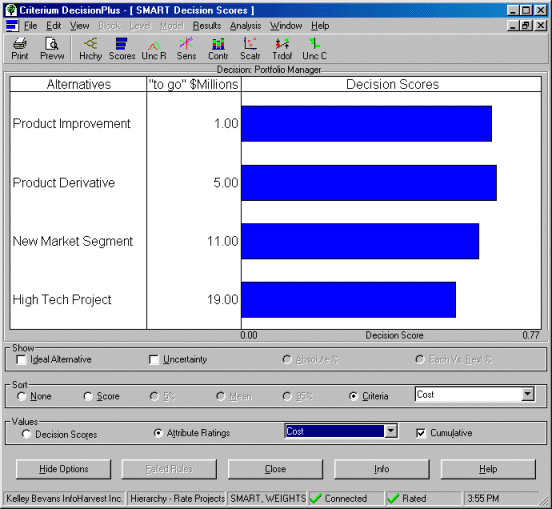
The cumulating of "To Go Costs" is shown under the "to go $million" column. If the company has 12 million budgetary dollars to spend and has to maintain this hard financial position, then the decision is straightforward. Based on the ranking of the projects and the cumulative costs, Project "High Tech Project" is given the " Kill" decision.
Summary
In summary, this model is based on the Hoechst-AG process as presented in the book "Portfolio Management for New Products" as stated at the beginning of this report. It is used to show how the portfolio management process can be enhanced by the use of decision analysis tools such as CDP. Experience with other companies has resulted in very different models. The models are based on the companies' in-place product development processes. In many cases, the processes are modified to invigorate the product development process. Wherever possible, the models should be based on quantitative data collected on the projects.
In most cases a number of models are required. Each decision point in the life of a project requires a tailored model to capture the appropriate criteria and data necessary to make the best decision possible.
This report has not addressed the question of uncertainty or risk. CDP has been designed to include the effects of known or estimated uncertainty in the data used to evaluate alternatives. Essentially, uncertainty can be included in the decision model by selecting appropriate probability distributions and including them in the model. The effect of the uncertainties can then be assessed in the decision process. Contact InfoHarvest for more information or for assistance in your product development processes and decisions.
About the Author
Bob Layton, Associate CDP Consultant
Bob Layton a co-designer of Criterium DecisionPlus, has been a systems engineer, systems engineering manager, project manager and consultant to the Aerospace industry for over 30 years. He worked as an electronics engineer in research as part of the Re-entry Physics Group at Bendix Systems Division in the early 1960s and as a Radar Systems Engineer at Hughes Aircraft in the late 1960s and early 1970s. In the 70s, 80s, and early 90s he was a Systems/Software Engineer and Manager at Boeing. For Five years he was Product Line Manager in the Product Development Organization making "Go/Kill" decision like those in this report. Since that time he has been involved in systems engineering and decision analysis consulting. He has been applying decision analysis techniques and tools in conjunction with other analytical and development methodologies and supporting tools to both small and large projects for over a decade. Mr. Layton's specialty is in the application of decision analysis techniques to the management of complex programs, product portfolio management, and strategic planning (acquisition, new ventures, etc.).